
Podcast: Play in new window | Download
Subscribe: RSS
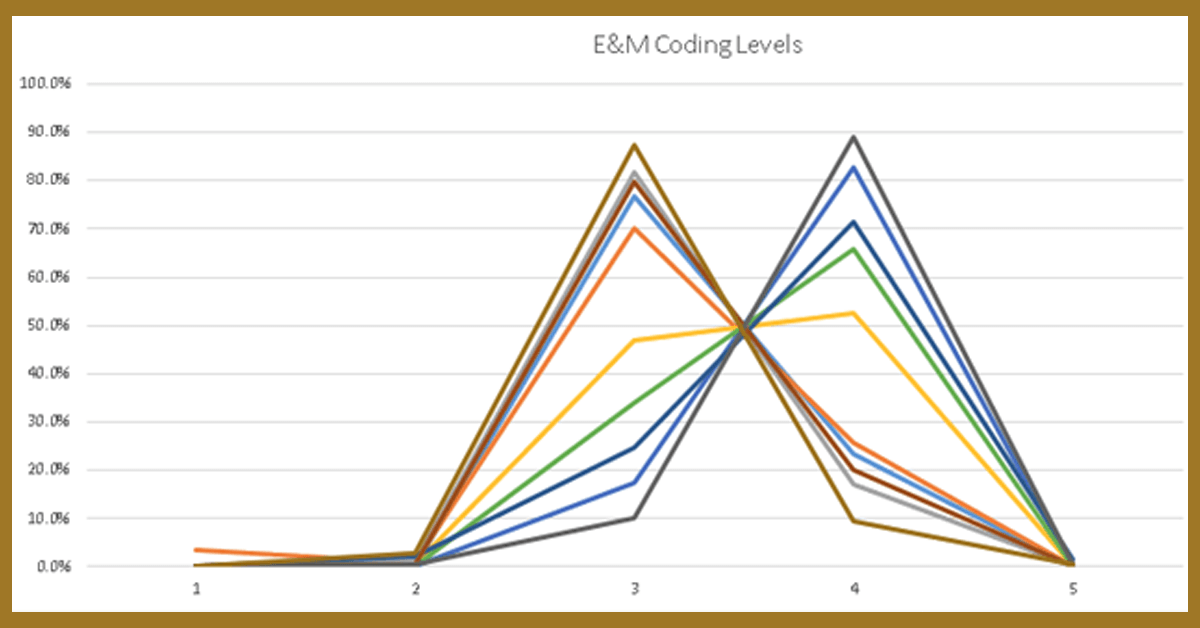
I hope you can see the artwork with this podcast. It’s an E&M Coding chart I did for a group recently, and is as close to art as you are going to get from this data guy. When was the last time you plotted your E&M Coding levels? What insights can you glean? We pulled this data from a larger dataset with all billed charges, which offers even more insight into productivity at this practice. Billed charges can tell you charges or work RVUs by provider, who is doing which procedures, how many new patients you’ve seen, who is referring patients, and much more. I hope today’s BIG Ideas podcast will give you some ideas on using your data.