
Podcast: Play in new window | Download
Subscribe: RSS
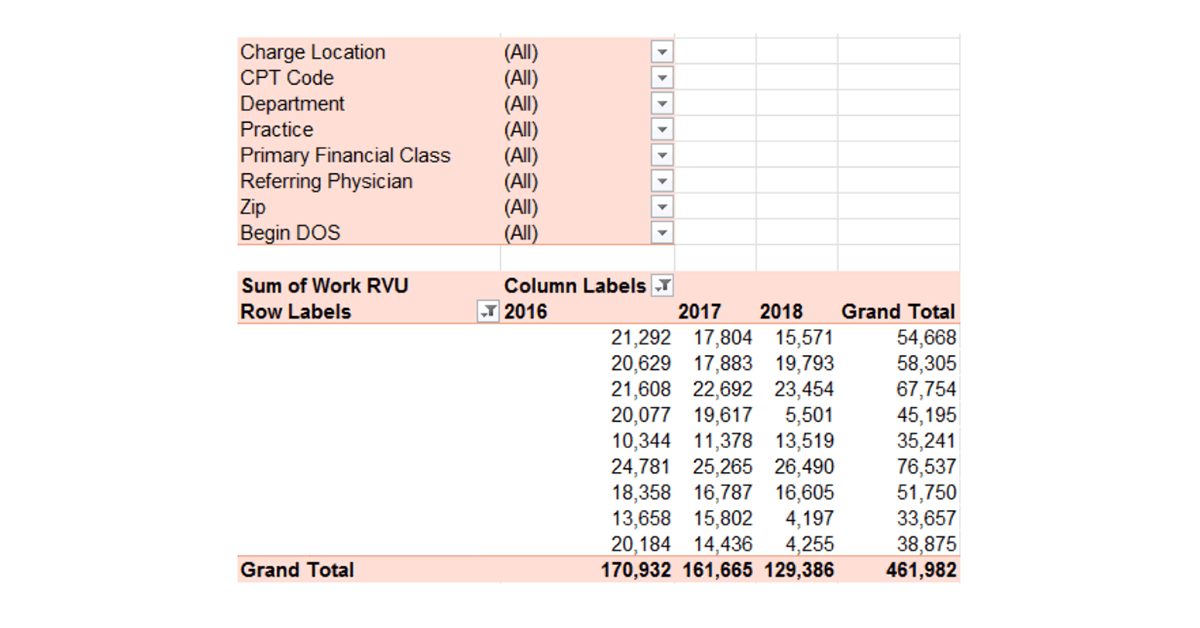
This BIG Idea is based on a webinar I did for MGMA the week before last on Pivot Tables. If you haven’t seen your data in Pivot Tables, in some sense you haven’t seen your data. Pivot Tables make it easy to analyze, trend, and understand your data in ways traditional canned reports can’t touch. One well-designed Pivot Table can replace dozens of canned reports. In the webinar we used Pivot Tables to analyze practice collections, payer reimbursement, and marketing information. I was onsite at a practice in Florida just the other day where we used Pivot Tables to understand marketing strategies for new practices. Get your data out of your practice management system, EHR, or accounting system. Organize that data in a Pivot Table. Then watch insight after insight appear to both you and your providers.